I recently read a blog post from Mike Shi called The future of observability won’t be one proprietary AI agent. It will be thousands built by teams.
In the post, he identifies why organizations will need agents tailored to their own environments rather than a single, centralized SRE agent. Much of the context required to debug production lives outside the database, in Slack, GitHub, runbooks, and engineers’ heads.
However, at the same time, every application seems to be building its own agent. In one organization you may have a dozen agents in the products you use: Notion, Linear, Slack, GitHub. That approach works for casual users, but it limits power users like me. I want to choose my own harness, model, and skills, then connect that agent to the products I already use.
Rhys Sullivan captures this tension in his X article titled ”i don’t want to use your agent“:
In it, he argues that products should build their agents on top of the skills, knowledge, MCPs and APIs their users already use. I strongly agree, and there are more than enough options to build this way. Over the course of two days, I built an MVP SRE agent for ClickStack. Building it forced me to decide which parts ClickStack should own and which should be delegated to an agent framework.
Choosing a Framework
The first decision was how much of the agent stack I wanted the framework to own. The options range from low-level libraries like AI SDK, to full frameworks like Flue and Eve, to hosted runtimes like Claude Managed Agents.
Some primitives I was looking for in a framework were:
- Ideally, a real agent harness close to what developers are using
- Support for MCPs, Skills, Durability, and Sandboxes
- Ability for users to easily self-host
- Freedom to choose model, provider (for ex: users using internally deployed models)
With those requirements in mind, I evaluated a few options:
- AI SDK: a great library of low-level building blocks, but would require building the durability, skills, and harness myself.
- Flue: built on Pi, open source, and easily self-hostable.
- Vercel Eve: strong durability and checks all boxes above, however leans on Vercel Workflows and Vercel Functions which make it a bit harder to self-host.
- Claude Managed Agents: the most turnkey option, but everything lives in Anthropic’s hosted runtime, meaning users couldn’t bring their own model or provider, or directly own their data.
I ended up choosing Flue. I’ve had great experiences with AI SDK and Vercel Eve in other projects, but Flue was the best fit for the requirements here. By delegating much of the agent infrastructure to the framework, we can focus on the investigation experience, domain skills, MCPs, tools, and overall performance of the agent. It also provides a clean way to dogfood ClickStack’s existing MCP server.
A First Pass at an SRE Agent
When thinking about the right agent investigation experience, I intentionally did not want to create a chatbot. Agents of the future will be proactive, work in the background, and eventually own the whole loop. ClickStack has alerts, so I opted for triggering an investigation workflow when an alert fires.
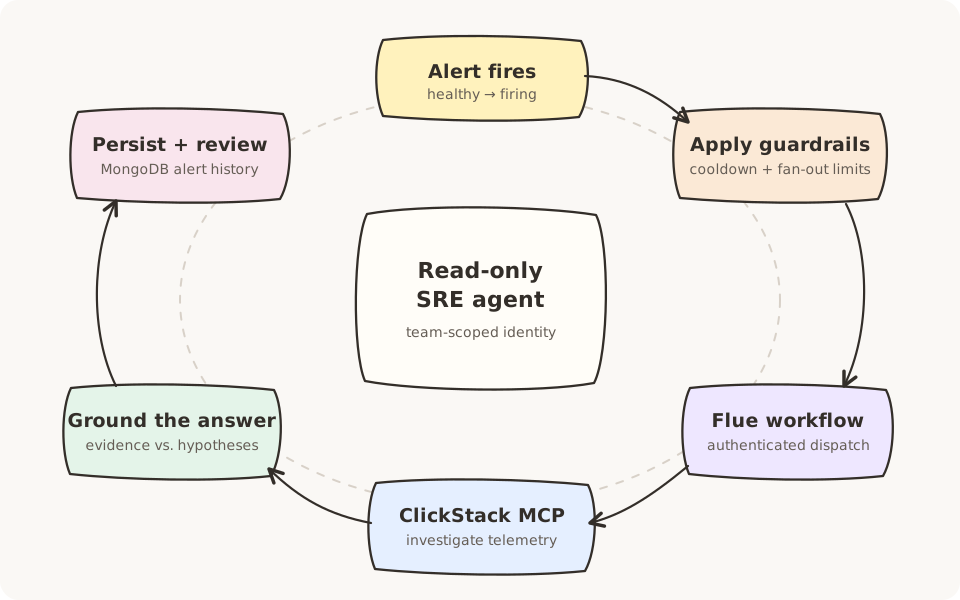
When an alert moves from healthy → firing, ClickStack triggers an investigation via a Flue Workflow. The agent must receive the alert and use the existing ClickStack MCP tools to investigate the surrounding context.
Design Decisions
For this MVP, I drew a clear boundary between the agent and ClickStack. Flue owns the execution and investigation while ClickStack owns the tools and final result.
The agent accesses ClickStack through its existing MCP server. This keeps the interface reusable and means the built-in agent uses the same tools that ClickStack can expose to agents operated by its users.
Persisting Investigations in ClickStack
I chose to store each investigation’s final report in MongoDB instead of just pushing a notification and moving on (we’ll add notifications later). Persisting results means users can browse past investigations, and the agent can pull them in as context when investigating similar alerts down the road.
Taking It for a Spin
I simulated a classic ClickHouse incident: a misconfigured table that starts rejecting writes with the infamous TOO_MANY_PARTS error, with a checkout service logging every failure. The alert fired, and here’s the agent’s trajectory and final response.
I always think viewing the agent’s reasoning is interesting — click any entry to expand it.
finish returned validated structured findings: { summary, gist } demo.order_events has a per-table setting parts_to_throw_insert = 10 (vs default 3000); single-row async inserts filled the single partition with 10 tiny parts that were never merged, so ClickHouse rejects all further inserts with TOO_MANY_PARTS, surfacing as the checkout error-log spike.
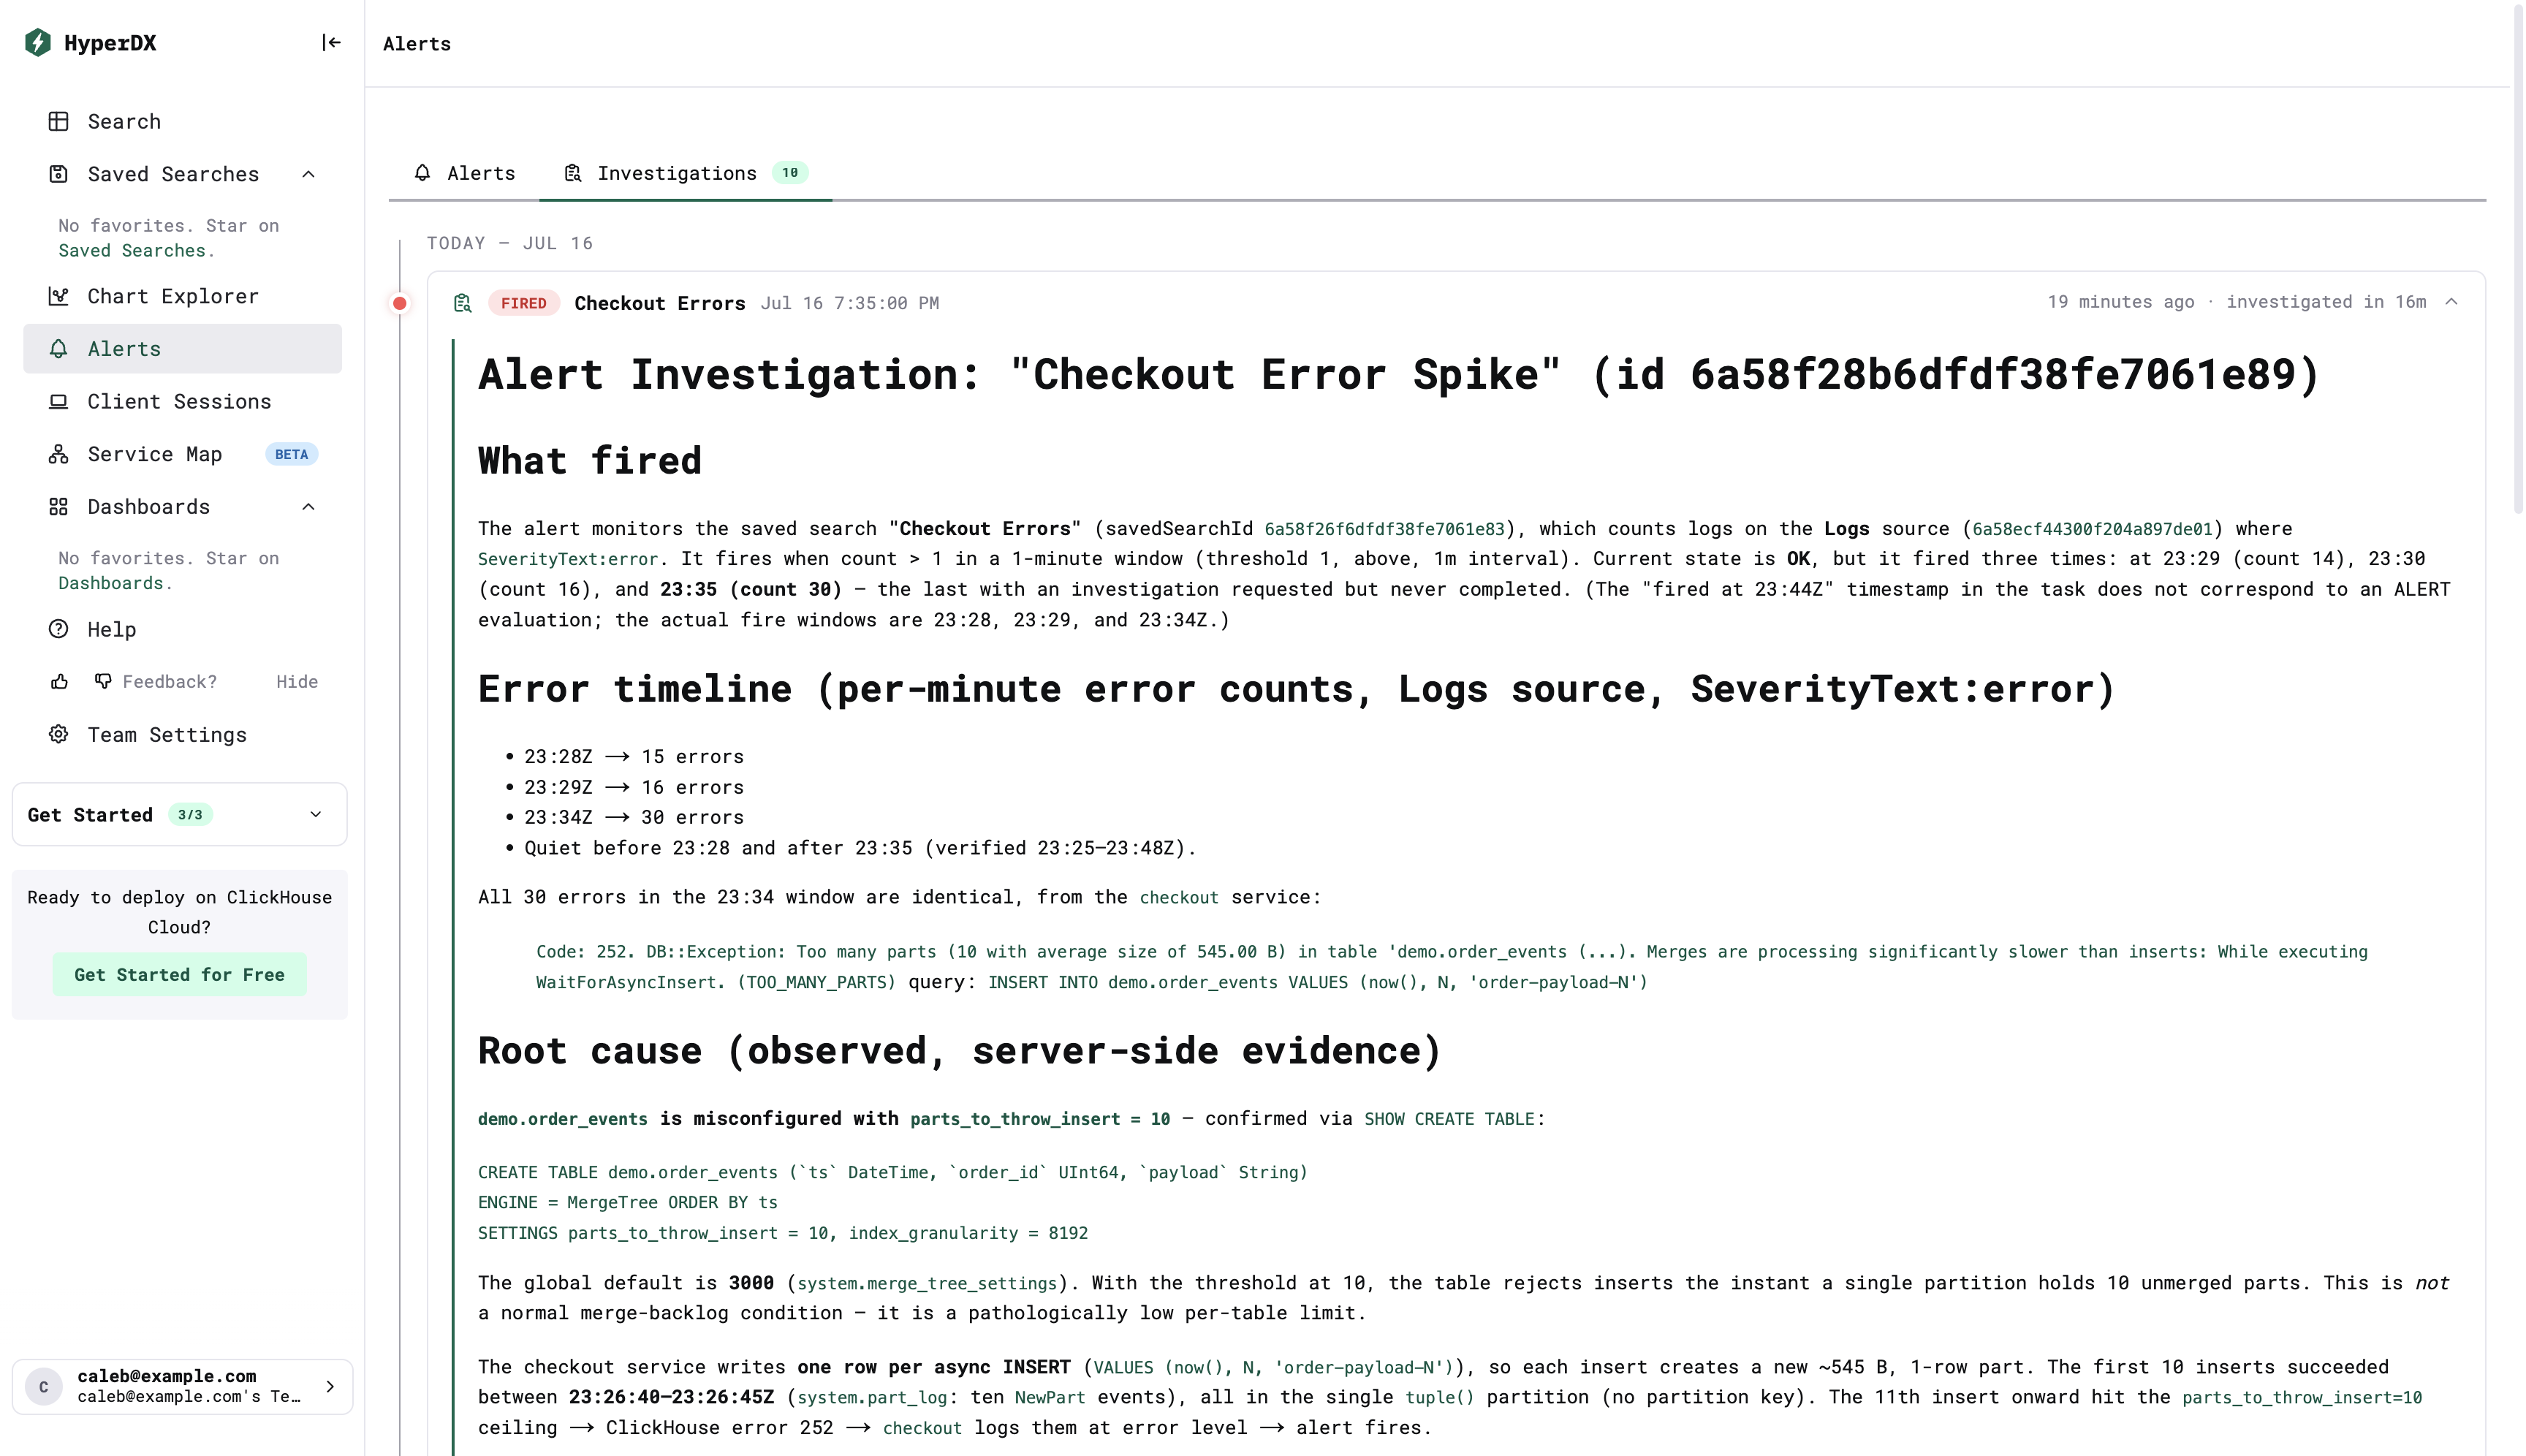
Alert Investigation: “Checkout Error Spike”
What fired — The alert monitors the saved search “Checkout Errors”, which counts logs on the Logs source where SeverityText:error. It fires when count > 1 in a 1-minute window. Current state is OK, but it fired three times: at 23:29 (count 14), 23:30 (count 16), and 23:35 (count 30).
Error timeline — 23:28Z → 15 errors, 23:29Z → 16 errors, 23:34Z → 30 errors. Quiet before 23:28 and after 23:35 (verified 23:25–23:48Z). All 30 errors in the 23:34 window are identical, from the checkout service:
Code: 252. DB::Exception: Too many parts (10 with average size of 545.00 B) in table 'demo.order_events'. Merges are processing significantly slower than inserts: While executing WaitForAsyncInsert. (TOO_MANY_PARTS)
Root cause (observed, server-side evidence)
demo.order_events is misconfigured with parts_to_throw_insert = 10 — confirmed via SHOW CREATE TABLE:
CREATE TABLE demo.order_events (`ts` DateTime, `order_id` UInt64, `payload` String)
ENGINE = MergeTree ORDER BY ts
SETTINGS parts_to_throw_insert = 10, index_granularity = 8192
The global default is 3000 (system.merge_tree_settings). With the threshold at 10, the table rejects inserts the instant a single partition holds 10 unmerged parts. This is not a normal merge-backlog condition — it is a pathologically low per-table limit.
The checkout service writes one row per async INSERT, so each insert creates a new ~545 B, 1-row part. The first 10 inserts succeeded between 23:26:40–23:26:45Z (system.part_log: ten NewPart events), all in the single tuple() partition. The 11th insert onward hit the ceiling → ClickHouse error 252 → checkout logs them at error level → alert fires.
Why it “recovered” but is NOT actually fixed
system.parts: 10 active parts still present right now, all level 0 (never merged).system.part_log: onlyNewPartevents — a merge has never been attempted for this table.system.metrics:MergeTreeBackgroundExecutorThreads=48with all 48 active/scheduled — the background merge executor is saturated by other heavy merges, so the 10 tiny parts never get scheduled.
The alert returned to OK only because the checkout service stopped retrying. The table is still pinned exactly at the throw threshold, so the very next insert will fail again. system.errors corroborates: TOO_MANY_PARTS count = 80.
Remediation (prioritized)
Immediate mitigation: ALTER TABLE demo.order_events MODIFY SETTING parts_to_throw_insert = 3000; then OPTIMIZE TABLE demo.order_events FINAL; to collapse the 10 level-0 parts. If inserts must continue, batch them — single-row inserts are the worst-case pattern for MergeTree.
Durable fix: remove the override permanently (use parts_to_delay_insert to throttle rather than hard-reject); add a partition key; investigate the merge executor saturation (48/48 threads); and alert on active-part count so this is caught before inserts start failing.
Nobody told the agent about the misconfigured setting. It ran SHOW CREATE TABLE, compared the value against the global default in system.merge_tree_settings, called it “a pathologically low per-table limit”, and even warned the alert’s return to OK was a false recovery — the very next insert would fail again. The final answer is validated { summary, gist } via a valibot result schema, so nothing parses model output with regexes.
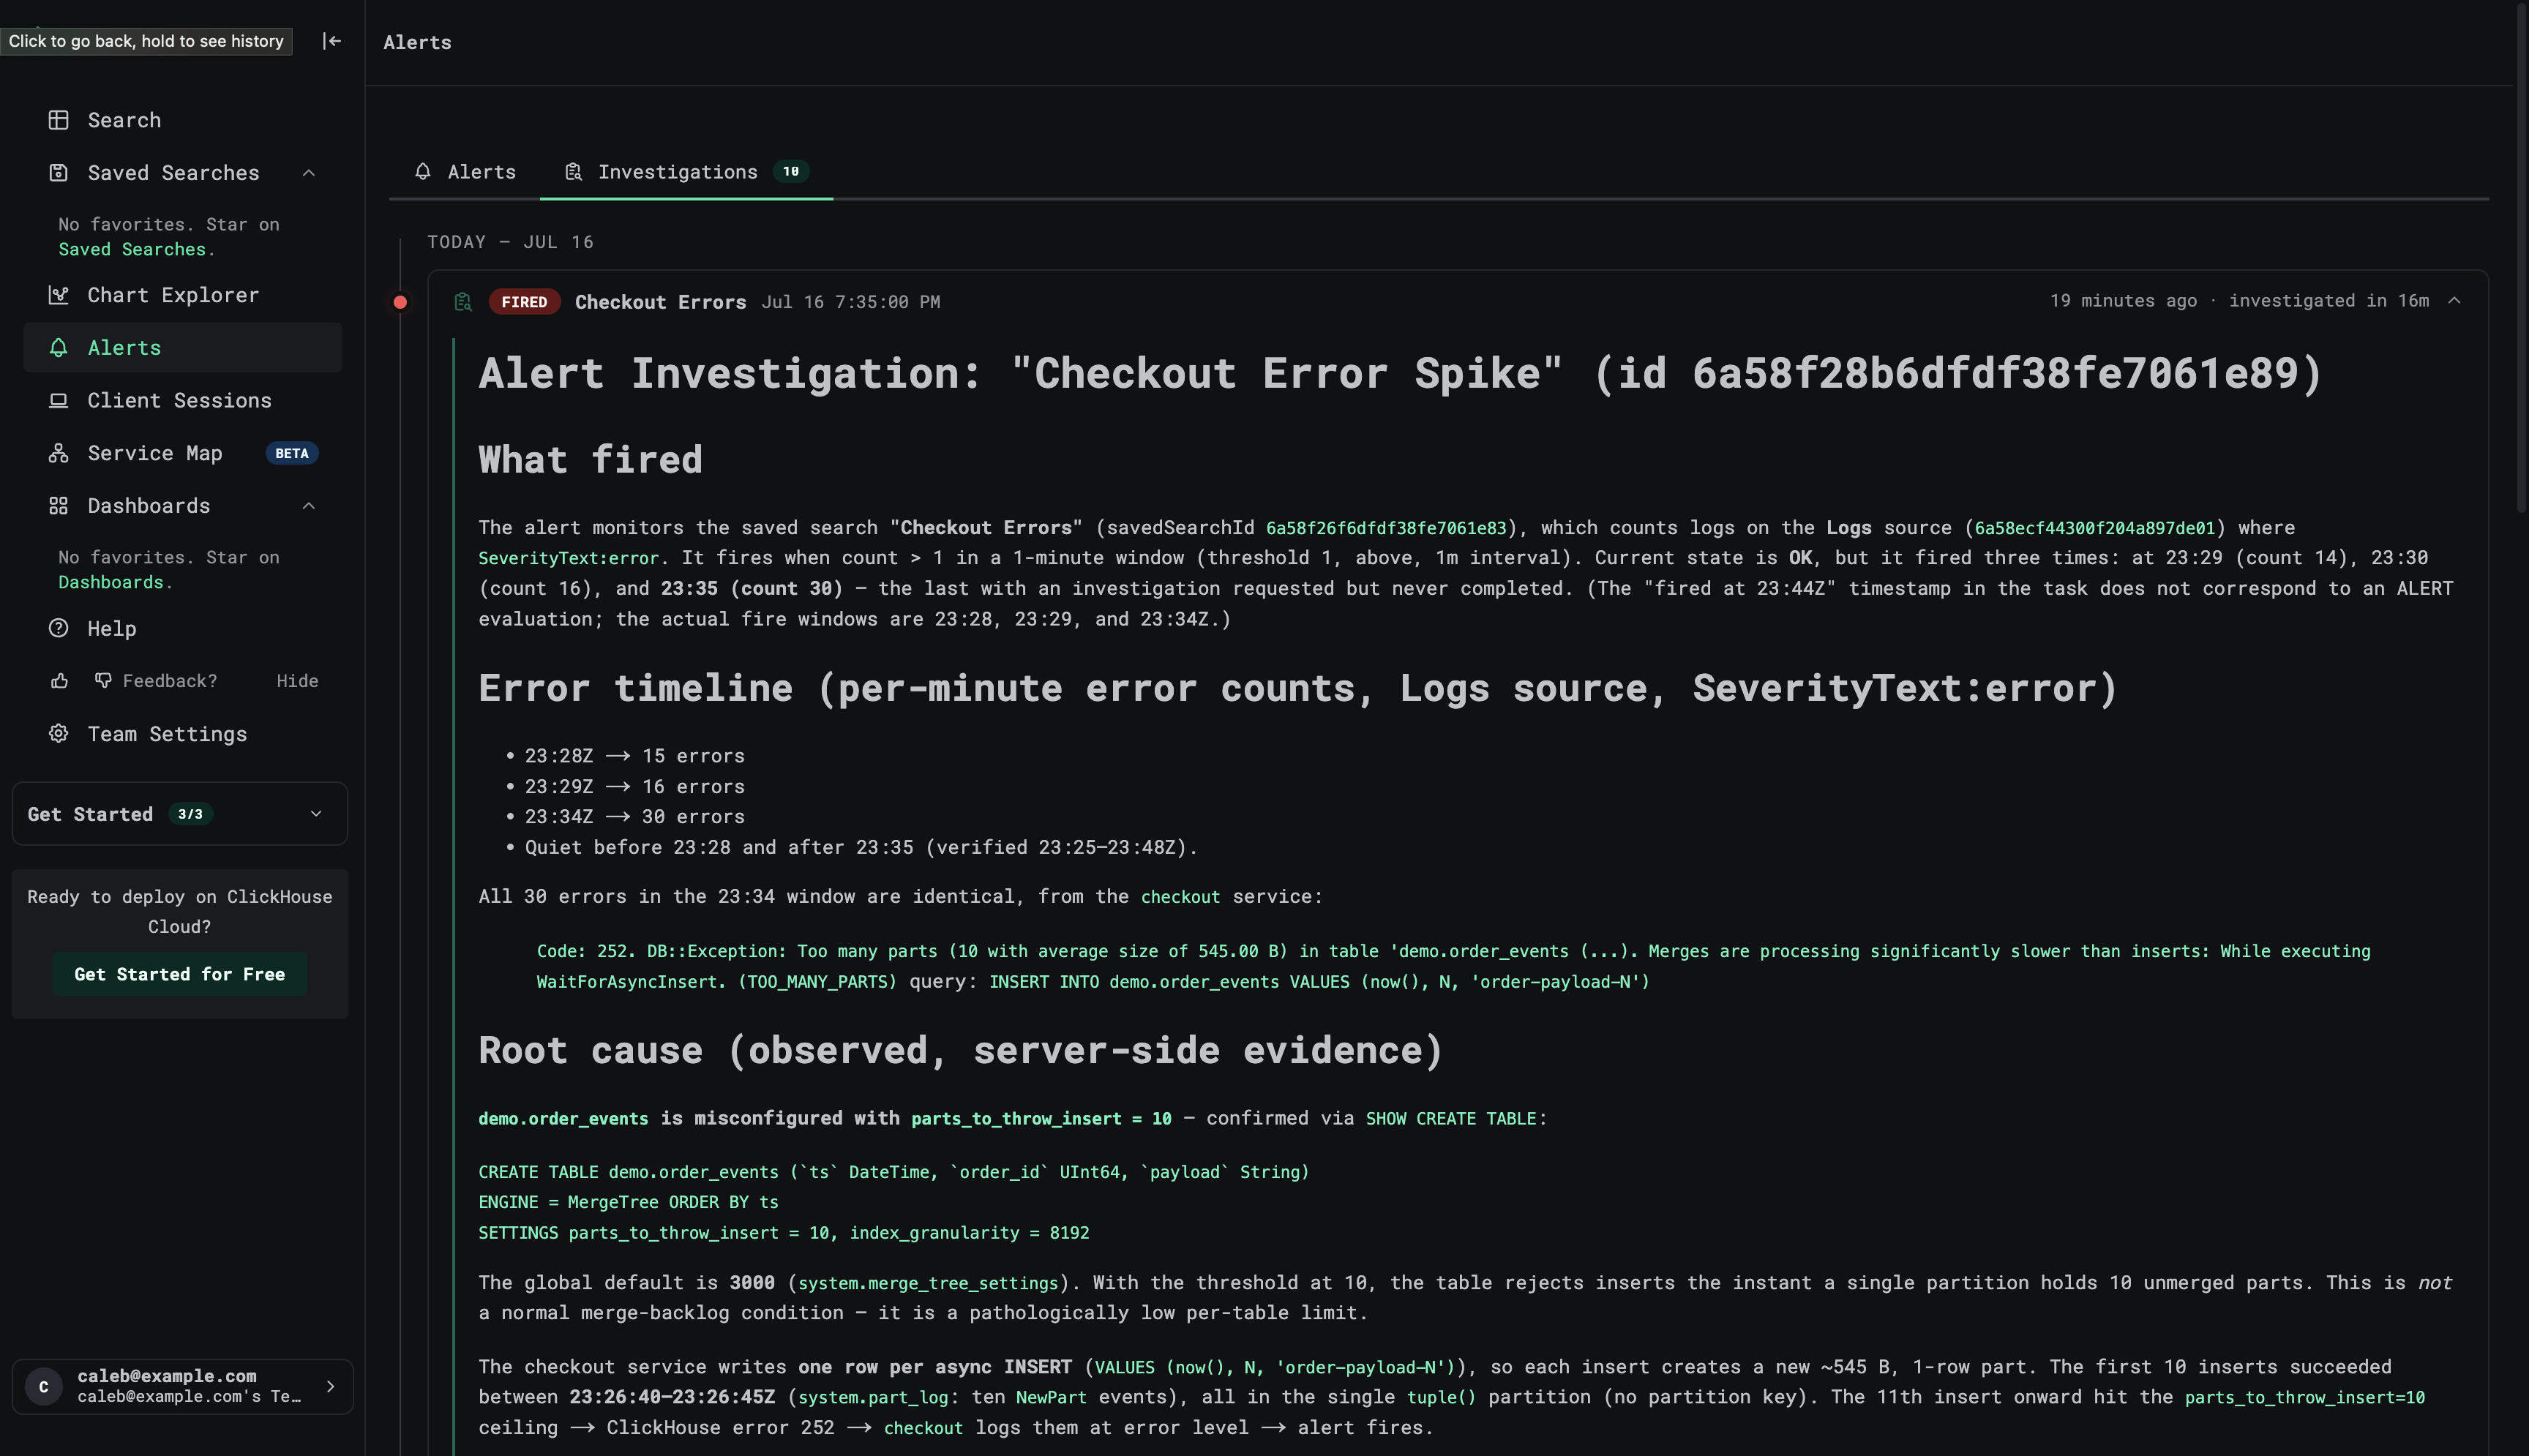
Here’s what the investigation looks like in ClickStack:
Open Questions
This was two days of work, so plenty is missing. Everything is scoped to a single deployment rather than per team, the agent has no memory of past investigations (so it can’t recognize a recurring incident), and a run that dies halfway just disappears. Lastly, we would need some evals — something to verify the agent is using the tools correctly to provide the right output.
Where Next?
The agent only sees what’s in ClickStack today, but most incident context lives in Slack, GitHub, and engineers’ heads. I’d start with Slack — post findings in the incident channel and let the agent read what people have already tried. GitHub after that, for recent PRs and deploys.
Mike and Rhys are pointing at the same thing: ship a good built-in agent, and expose the same tools so people can bring their own.
The full implementation lives on my HyperDX fork if you want to dig in.